Multiple Choice
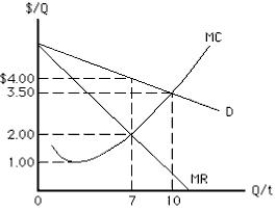
The figure below shows the cost and revenue curves for a monopolist. Assume that the marginal cost of production is equal to the average total cost at the profit maximizing output level. The maximum profit for this monopolist if he does not practice price discrimination is _____.
Figure 9.4
A) $4
B) $14
C) $3.50
D) $21
E) $4.
Correct Answer:

Verified
Correct Answer:
Verified
Q8: Perfectly competitive firms and monopolistic firms determine
Q64: The figure below shows the cost and
Q66: Barriers to entry:<br>A)cause monopolies to experience diseconomies
Q68: A monopolist that engages in perfect price
Q70: The figure below shows the cost and
Q71: The figure below shows the total cost
Q72: The figure given below depicts a monopoly
Q74: Suppose a single firm supplies all the
Q121: Total deadweight loss in society is reduced
Q160: If a monopolist that does not practice