Multiple Choice
The figure below shows the cost and revenue curves for a monopolist. The maximum profit earned by the non-discriminating monopolist is:
Figure 9.6
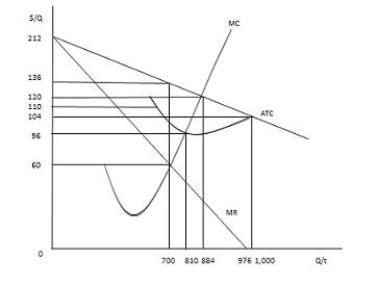
A) $95,200.
B) $84,000.
C) $53,200.
D) $42,000.
E) $18,200.
Correct Answer:

Verified
Correct Answer:
Verified
Related Questions
Q8: Perfectly competitive firms and monopolistic firms determine
Q66: Barriers to entry:<br>A)cause monopolies to experience diseconomies
Q68: A monopolist that engages in perfect price
Q69: The figure below shows the cost and
Q71: The figure below shows the total cost
Q72: The figure given below depicts a monopoly
Q74: Suppose a single firm supplies all the
Q121: Total deadweight loss in society is reduced
Q160: If a monopolist that does not practice
Q179: Which of the following is most likely