Multiple Choice
The figure below shows the cost and revenue curves for a monopolist. The profit-maximizing output for this non-discriminating monopolist is:
Figure 9.5
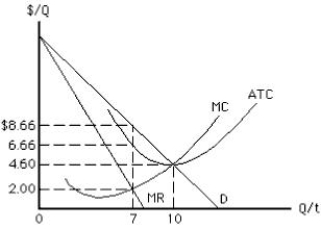
A) 0.
B) 7 units.
C) 10 units.
D) more than 10 units.
E) less than 7 units but more than 0.
Correct Answer:

Verified
Correct Answer:
Verified
Related Questions
Q19: The figure below shows the cost and
Q20: Which of the following is true for
Q21: A monopolist is likely to overcome a
Q22: According to the information provided in the
Q23: The figure below shows the cost and
Q26: The figure below shows the cost and
Q29: Which of the following is not a
Q42: The demand curve facing a non-discriminating monopolist
Q58: McDonald's makes its unique McRib sandwich "available
Q159: A natural monopoly forms when _<br>A)small firms