Multiple Choice
The figure below shows the cost and revenue curves for a non-discriminating monopolist. The profit-maximizing output and price for a monopolist are:
Figure 9.2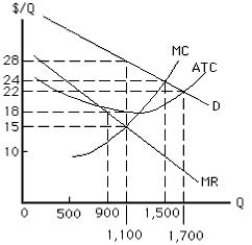
A) 90 units and $18, respectively.
B) 1,500 units and $24, respectively.
C) 1,700 units and $22, respectively.
D) 1,100 units and $28, respectively.
E) 1,500 units and $22, respectively.
Correct Answer:

Verified
Correct Answer:
Verified
Q14: The figure below shows the cost and
Q15: According to the information provided in the
Q19: Suppose a monopolist must choose between two
Q20: Which of the following is true for
Q21: A monopolist is likely to overcome a
Q22: According to the information provided in the
Q23: The figure below shows the cost and
Q24: The figure below shows the cost and
Q83: The practice of charging different prices to
Q100: A natural monopoly forms when a firm