Multiple Choice
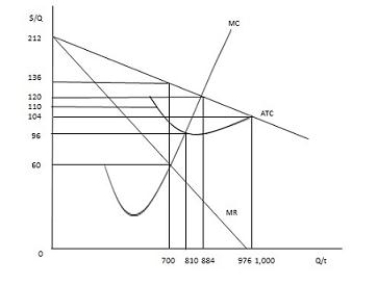
The figure below shows the cost and revenue curves for a monopolist. If the monopolist chooses to produce 1,000 units and does not discriminate among its customers, its total profit will be _____.
Figure 9.6
A) $0
B) $104,000
C) $212,000
D) maximized
E) negative
Correct Answer:

Verified
Correct Answer:
Verified
Q9: Identify a distinguishing feature of monopoly.<br>A)There are
Q13: According to the information provided in the
Q15: A natural monopoly emerges from legal restrictions
Q15: According to the information provided in the
Q19: Suppose a monopolist must choose between two
Q19: The figure below shows the cost and
Q57: A monopolist's demand curve is _<br>A)its marginal
Q83: The practice of charging different prices to
Q100: A natural monopoly forms when a firm
Q177: If the marginal cost curve shifts upward,a