Multiple Choice
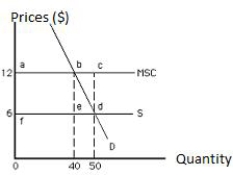
The following graph shows market equilibrium in the presence of an externality. The total social gain from producing the socially efficient output is:
Figure 17.2
A) $60.
B) $30.
C) $6.
D) $480.
E) $300.
Correct Answer:

Verified
Correct Answer:
Verified
Related Questions
Q8: Marginal social cost is equal to _<br>A)the
Q28: Which of the following accounts for the
Q30: An individual who listens to loud music
Q32: The optimal level of air quality will
Q34: If the consumption of education creates a
Q34: The following graph shows the market for
Q35: A person can cause a negative externality
Q59: The common-pool problem arises _<br>A)when goods are
Q105: If the marginal social cost of producing
Q161: The deforestation of rainforests due to human