Multiple Choice
The following graph shows the market for pollution rights. The supply curve represents the amount of ______.
Figure 17.4
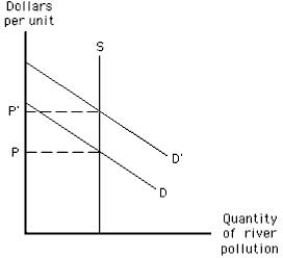
A) toxins the firms want to dump into the river
B) water that can be used as an input by firms
C) toxins that can be dumped into the river without reducing the water quality below a certain level
D) pollution the firm is willing to clean up
E) the pollution-causing good supplied by the industry
Correct Answer:

Verified
Correct Answer:
Verified
Q8: Marginal social cost is equal to _<br>A)the
Q31: The following graph shows market equilibrium in
Q32: The optimal level of air quality will
Q34: If the consumption of education creates a
Q35: A person can cause a negative externality
Q38: If education creates positive externalities, then:<br>A)private markets
Q55: Open-access resources tend to be _<br>A)conserved.<br>B)taxed.<br>C)overused.<br>D)efficiently used.<br>E)underutilized.
Q59: The common-pool problem arises _<br>A)when goods are
Q134: Markets tend to underproduce goods that generate
Q161: The deforestation of rainforests due to human