Multiple Choice
The following graph shows the market for pollution rights in an economy. The social welfare loss that results from 70 units of air quality is shown by area _____.
Figure 17.3
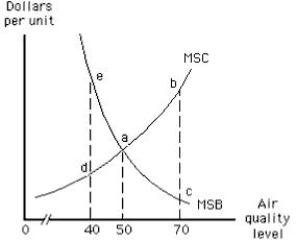
A) edcb
B) eda
C) bac
D) adc
E) eab
Correct Answer:

Verified
Correct Answer:
Verified
Related Questions
Q10: The equilibrium price and quantity in a
Q49: A metal-stamping factory moves next to a
Q52: A meditation class meets on the second
Q56: The price of a pollution right is
Q57: According to the Coase theorem, externality problems
Q58: The following graph shows the optimal allocation
Q145: When the consumption of a good or
Q146: Unpriced byproducts of production or consumption that
Q149: Suppose the production of electricity generates pollution.In
Q164: It is in the long-run economic interest