Multiple Choice
The following graph shows the optimal allocation of pollution rights to firms polluting a river. If the government does not charge firms for polluting the river, the ______.
Figure 17.5
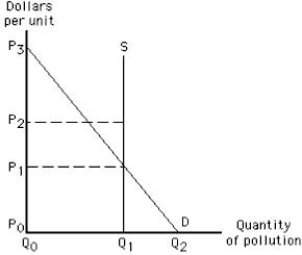
A) firms will emit Q1 units of the pollutant at a price of P0 each
B) firms will emit Q2 units of the pollutant at a price of P0 each
C) firms will emit Q0 units of the pollutant at a price of P3 each
D) firms will emit Q1 units of the pollutant at a price of P1 each
E) firms will emit Q2 units of the pollutant at a price of P0 each.
Correct Answer:

Verified
Correct Answer:
Verified
Q10: The equilibrium price and quantity in a
Q22: Most of the Superfund expenditures have been
Q54: The following graph shows the market for
Q56: The price of a pollution right is
Q57: According to the Coase theorem, externality problems
Q61: Fish in the sea can be harvested
Q62: A society is better off if the
Q145: When the consumption of a good or
Q149: Suppose the production of electricity generates pollution.In
Q162: In a free market,a firm's equilibrium output