Multiple Choice
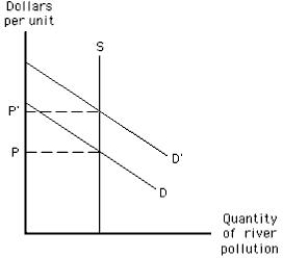
The following graph shows the market for pollution rights. An increase in demand indicates ______.
Figure 17.4
A) a rise in pollution
B) increased environmental damage
C) an increase in the price of the right to pollute
D) an increase in the benefit of cleaning up the pollution
E) an increase in the cost of cleaning up the river
Correct Answer:

Verified
Correct Answer:
Verified
Q48: Which of the following would happen if
Q57: According to the Coase theorem,there will be
Q81: If farmers decide individually whether or not
Q99: Pollution occurs because property rights to some
Q103: Which of the following is an example
Q104: A tannery discovers a technology that makes
Q109: The following graph shows market equilibrium in
Q111: Fishes in the ocean are:<br>A)exhaustible and also
Q123: Which of the following helps explain why
Q179: Governments often subsidize activities that generate positive