Multiple Choice
The following graph shows market equilibrium in the presence of an externality. The socially efficient price and level of output are:
Figure 17.2
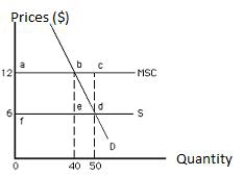
A) $6 and 50 units, respectively
B) $12 and 50 units, respectively
C) $12 and 40 units, respectively
D) $6 and 40 units, respectively
E) less than $6 and more than 50 units, respectively
Correct Answer:

Verified
Correct Answer:
Verified
Q48: Which of the following would happen if
Q57: According to the Coase theorem,there will be
Q81: If farmers decide individually whether or not
Q104: A tannery discovers a technology that makes
Q107: The following graph shows the market for
Q111: Fishes in the ocean are:<br>A)exhaustible and also
Q113: The following graph shows equilibrium in a
Q114: A meditation class meets on the second
Q123: Which of the following helps explain why
Q179: Governments often subsidize activities that generate positive