Multiple Choice
The following graph shows the demand, the supply, and the marginal social benefit curves. The socially efficient level of output is _______.
Figure 17.6
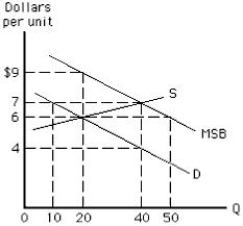
A) 0 units
B) 10 units
C) 20 units
D) 40 units
E) 50 units
Correct Answer:

Verified
Correct Answer:
Verified
Related Questions
Q17: The following graph shows the market for
Q20: Which of the following is a renewable
Q21: The socially efficient level of output is
Q23: Which of the following is a positive
Q28: Society's total cost of producing a good
Q30: An individual who listens to loud music
Q56: In order to increase society's well-being,measles vaccinations
Q105: If the marginal social cost of producing
Q139: Marginal social cost includes both the marginal
Q166: The marginal social benefit curve for water