Multiple Choice
The following graph shows the market for pollution rights. The shift of the demand curve from D to D' indicates that ______.
Figure 17.4
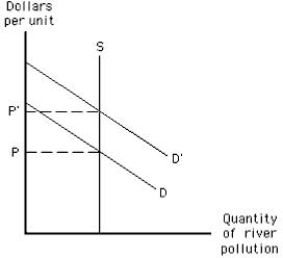
A) producers want to discharge more pollution into the river
B) producers want to use more of the river in a nonpolluting way
C) consumers want producers to clean up the polluted river
D) consumers want to buy goods that use technology that does not pollute
E) consumers want to buy technology that reduces pollution
Correct Answer:

Verified
Correct Answer:
Verified
Q12: Which of the following is not an
Q16: The following graph shows the demand, the
Q20: Which of the following is a renewable
Q22: The following graph shows the demand, the
Q28: Society's total cost of producing a good
Q47: The Clean Air Act of 1970 _<br>A)set
Q56: Suppose environmental groups pressure the local government
Q56: In order to increase society's well-being,measles vaccinations
Q143: Pollution occurs because property rights to exhaustible
Q166: The marginal social benefit curve for water