Multiple Choice
The following graph shows the demand, the supply, and the marginal social benefit curves. The graph shows market equilibrium in the presence of ______.
Figure 17.6
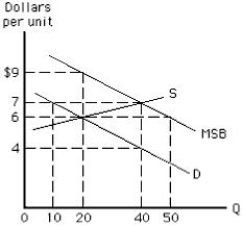
A) positive externalities
B) positive and negative externalities
C) negative externalities
D) the Coase theorem
E) asymmetric information
Correct Answer:

Verified
Correct Answer:
Verified
Q12: Which of the following is not an
Q17: The following graph shows the market for
Q18: To enhance social welfare,the government should encourage
Q20: Which of the following is a renewable
Q28: Society's total cost of producing a good
Q47: The Clean Air Act of 1970 _<br>A)set
Q56: Suppose environmental groups pressure the local government
Q56: In order to increase society's well-being,measles vaccinations
Q143: Pollution occurs because property rights to exhaustible
Q166: The marginal social benefit curve for water