Multiple Choice
The following diagram is a cost-volume-profit graph for a manufacturing company: 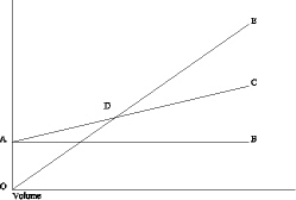 The formula to determine the Y-axis value ($) at point D on the graph is
A) Fixed costs + (Variable costs per unit ´ Number of units) .
B) SXY - bSX.
C) Fixed costs/Unit contribution margin.
D) Fixed costs/Contribution margin ratio.
Correct Answer:

Verified
Correct Answer:
Verified
Q3: Tiramisu Company projected the following information for
Q7: Summersville Production Company had the following projected
Q9: The income statement for Symbiosis Manufacturing Company
Q10: The Barrister Mug Company manufactures plastic mugs
Q18: CVP analysis is a short-run decision-making tool
Q46: Which of the following is a TRUE
Q48: Which of the following assumptions does NOT
Q53: Using cost-volume-profit analysis, we can conclude that
Q73: The margin of safety is<br>A)the number of
Q77: The variable cost ratio<br>A)expresses variable costs as