Multiple Choice
Using Figure 1.4,which of the following statements are accurate? 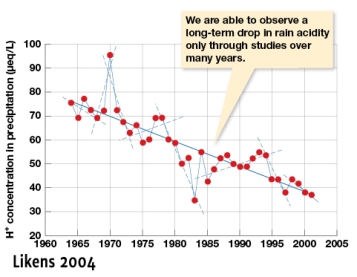
A) The overall trend shows a negative effect of time on hydrogen ion concentration in precipitation
B) From 1965 to 1975 the trend is flat
C) From 1965 to 1975 the trend is a decline in hydrogen ion concentration
D) The data need to be looked at year by year and not over this long a period
Correct Answer:

Verified
Correct Answer:
Verified
Q26: One reason to randomly sample is because:<br>A)
Q27: You want to understand the birth rate
Q28: Ecological phenomena occur at a variety of
Q29: You have gathered historical data on the
Q30: Pure science is:<br>A) The practical application of
Q32: You have collected data on the body
Q33: The _ is comprised of the community
Q34: Statistics assigns _ to an event as
Q35: You work on a research project to
Q36: There is a 100 square meter rectangular