Multiple Choice
Figure 3-8 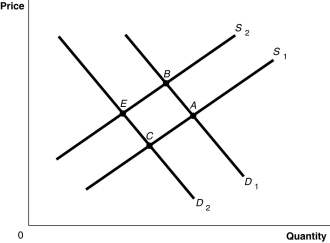
-Refer to Figure 3-8.The graph in this figure illustrates an initial competitive equilibrium in the market for apples at the intersection of D2 and S1 (point C) Which of the following changes would cause the equilibrium to change to point B?
A) A positive change in the technology used to produce apples and a decrease in the price of oranges, a substitute for apples.
B) An increase in the wages of apple workers and an increase in the price of oranges, a substitute for apples.
C) An increase in the number of apple producers and a decrease in the number of apple trees as a result of disease.
D) A decrease in the wages of apple workers and an increase in the price of oranges, a substitute for apples.
Correct Answer:

Verified
Correct Answer:
Verified
Q25: A change in which variable will change
Q29: Suppose that when the price of raspberries
Q62: Explain the endowment effect.
Q65: Behavioural economists examine choices that consumers make
Q79: Which of the following would shift the
Q89: Figure 3-7<br> <img src="https://d2lvgg3v3hfg70.cloudfront.net/TB4193/.jpg" alt="Figure 3-7
Q109: Draw a demand curve and label it
Q119: Figure 3-8 <img src="https://d2lvgg3v3hfg70.cloudfront.net/TB3018/.jpg" alt="Figure 3-8
Q124: Figure 3-6<br> <img src="https://d2lvgg3v3hfg70.cloudfront.net/TB4193/.jpg" alt="Figure 3-6
Q129: Figure 3-8 <img src="https://d2lvgg3v3hfg70.cloudfront.net/TB3018/.jpg" alt="Figure 3-8