Multiple Choice
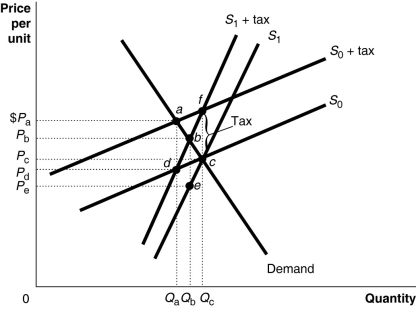 Figure 18-2 shows a demand curve and two sets of supply curves,one set more elastic than the other.
-Refer to Figure 18-2.If the government imposes an excise tax of $1.00 on every unit sold
A) the deadweight loss is identical under either supply curve.
B) the deadweight loss is greater under the supply curve S1.
C) the deadweight loss is greater under the supply curve S0.
D) there is no deadweight loss since revenue raised is used to fund government projects.
Correct Answer:

Verified
Correct Answer:
Verified
Q28: The "ability-to-pay" principle of taxation is the
Q31: For a given supply curve, the deadweight
Q51: What is a Lorenz curve and what
Q53: Explain why it is more difficult to
Q78: What is the difference between the voting
Q108: Absolute poverty measures vary from country to
Q169: Table 18-8<br> <img src="https://d2lvgg3v3hfg70.cloudfront.net/TB4193/.jpg" alt="Table 18-8
Q209: A key insight of the public choice
Q220: The political process is more likely to
Q255: An average tax rate is calculated as<br>A)total