Multiple Choice
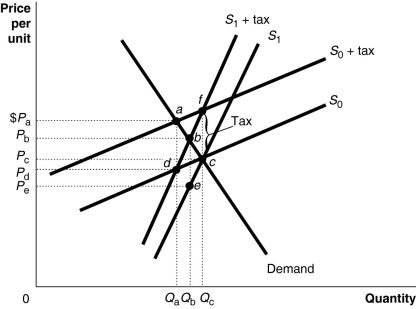
Figure 18-2  Figure 18-2 shows a demand curve and two sets of supply curves, one set more elastic than the other.
-Refer to Figure 18-2. If the government imposes an excise tax of $1.00 on every unit sold, the government's revenue from the tax
A) is larger if the supply curve is S0.
B) is larger if the supply curve is S1.
C) is identical under either supply curve.
D) is not maximized.
Correct Answer:

Verified
Correct Answer:
Verified
Q6: Table 18-5<br> <img src="https://d2lvgg3v3hfg70.cloudfront.net/TB4193/.jpg" alt="Table 18-5
Q48: Since lower-income people spend a larger proportion
Q51: What is a Lorenz curve and what
Q62: Holding all other factors constant, income earned
Q104: The government of Silverado raises revenue to
Q144: What is logrolling?<br>A)a situation where a policymaker
Q154: The average tax rate is calculated as<br>A)total
Q161: Figure 18-3 <img src="https://d2lvgg3v3hfg70.cloudfront.net/TB7397/.jpg" alt="Figure 18-3
Q187: Absolute poverty measures vary from country to
Q253: A tax is efficient if<br>A)individuals with the