Multiple Choice
Figure 3-2 shows the shifts in the demand curve for a good. A change from Point A to Point D represents a(n) :Figure 3-2 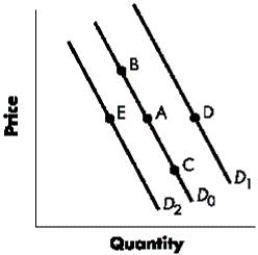
A) increase in demand
B) decrease in demand
C) decrease in quantity demanded.
D) increase in quantity demanded.
E) decrease in the price of the good
Correct Answer:

Verified
Correct Answer:
Verified
Related Questions
Q6: Figure 3-2 shows the shifts in the
Q8: If watermelons are normal goods, the demand
Q9: Figure 3-4 represents the market for butter.
Q12: Which of the following is a difference
Q13: Ceteris paribus, an increase in both equilibrium
Q14: The quantity sold of a daily newspaper
Q15: Figure 3-1 shows the shifts in the
Q16: Increasing government taxation or regulation of an
Q16: Why do markets tend toward equilibrium and,
Q39: Two goods are complements if an increase