Multiple Choice
Figure 3-1 shows the shifts in the demand curve for a good. Using the graph and beginning on D1, a shift to D0 would indicate a(n) :Figure 3-1 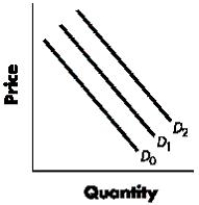
A) increase in demand.
B) decrease in demand.
C) increase in quantity demanded.
D) decrease in quantity demanded.
E) increase in the price of the good.
Correct Answer:

Verified
Correct Answer:
Verified
Related Questions
Q11: Figure 3-2 shows the shifts in the
Q12: Which of the following is a difference
Q13: Ceteris paribus, an increase in both equilibrium
Q14: The quantity sold of a daily newspaper
Q16: Why do markets tend toward equilibrium and,
Q17: Figure 3-3 shows shifts in the supply
Q18: A movement along the supply curve of
Q20: If a surplus exists in a market,
Q39: Two goods are complements if an increase
Q180: If the price of pizza falls, the