Multiple Choice
Figure 3-3 shows shifts in the supply curve of a good. A change from Point A to Point B represents a(n) :Figure 3-3 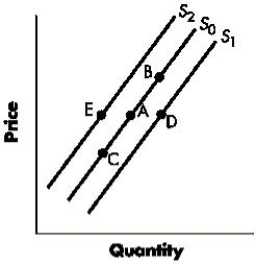
A) increase in the supply of the good.
B) decrease in the supply of the good
C) increase in the quantity supplied of the good.
D) decrease in the quantity supplied of the good.
E) decrease in the price of the good.
Correct Answer:

Verified
Correct Answer:
Verified
Q12: Which of the following is a difference
Q13: Ceteris paribus, an increase in both equilibrium
Q14: The quantity sold of a daily newspaper
Q15: Figure 3-1 shows the shifts in the
Q16: Why do markets tend toward equilibrium and,
Q18: A movement along the supply curve of
Q20: If a surplus exists in a market,
Q21: Table 3-3 shows the market demand and
Q22: Which of the following is true of
Q180: If the price of pizza falls, the