Multiple Choice
Graph A below shows an elastic demand curve, and Graph B shows an inelastic demand curve. With reference to Graph A, at a price of $10, total revenue equals _____.Figure 4.1: 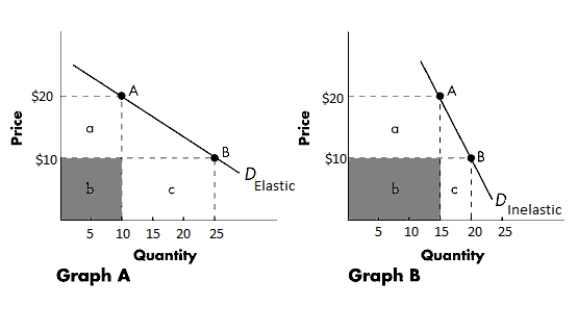
A) $250
B) $400
C) $500
D) $1,000
E) $150
Correct Answer:

Verified
Correct Answer:
Verified
Related Questions
Q63: Price elasticity of demand is defined as
Q64: If the demand for a good is
Q65: Graph A below shows an elastic demand
Q66: Arrange the following goods from the least
Q67: A price floor is binding when it
Q69: The following table shows Kate's demand for
Q70: If most passenger trains operate far below
Q71: The demand for a good is said
Q72: If a consumer buys six units of
Q73: The government proposes a tax on flowers