Multiple Choice
Graph A below shows an elastic demand curve, and Graph B shows an inelastic demand curve. Graph A shows that as the price decreases from $20 to $10, total revenue _____ and quantity demanded _____.Figure 4.1: 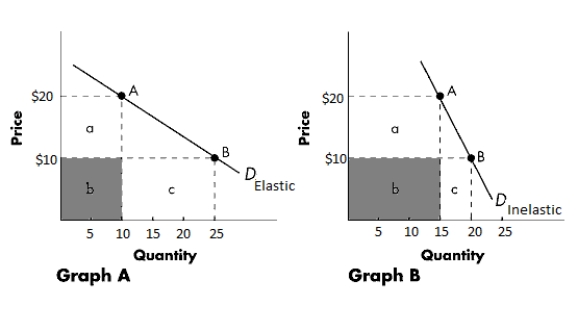
A) decreases; increases
B) decreases; decreases
C) increases; increases
D) increases; decreases
E) remains unchanged; remains unchanged
Correct Answer:

Verified
Correct Answer:
Verified
Q60: Suppose a government imposes a binding price
Q61: Among the following pairs, which is likely
Q62: If the demand for a good is
Q63: Price elasticity of demand is defined as
Q64: If the demand for a good is
Q66: Arrange the following goods from the least
Q67: A price floor is binding when it
Q68: Graph A below shows an elastic demand
Q69: The following table shows Kate's demand for
Q70: If most passenger trains operate far below