Multiple Choice
The figure below shows the relationship between the real GDP and the price level of an economy. In the figure, _____ represents aggregate demand.Figure 13-1 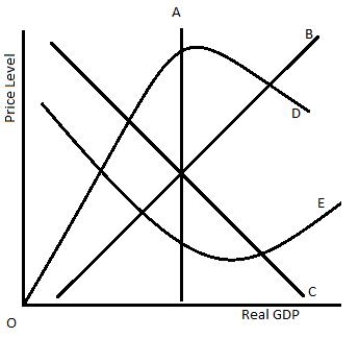
A) curve A
B) curve B
C) curve C
D) curve D
E) curve E
Correct Answer:

Verified
Correct Answer:
Verified
Related Questions
Q21: What is the natural level of output?
Q62: Figure 13-6 shows the short-run macroeconomic equilibrium
Q63: Which of the following will decrease aggregate
Q64: Figure 13-2 shows shifts in the aggregate
Q66: Ceteris paribus, which of the following would
Q70: The interest rate effect suggests that the
Q71: In the short run, an increase in
Q86: The long-run aggregate supply curve is the
Q102: Explain why the short-run supply curve is
Q112: Discuss the difference between an increase in