Multiple Choice
Figure 13-2 shows shifts in the aggregate demand curve. Which of the following combinations would be illustrated by a shift in aggregate demand from AD0 to AD2?Figure 13-2 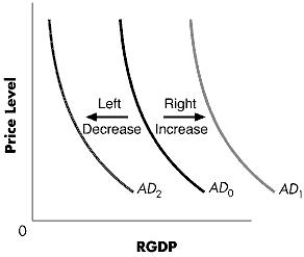
A) A decrease in the minimum wage level combined with an increase in imports
B) An increase in the price levels combined with an increase in the rates of interest
C) An increase in business tax rates combined with a decrease in consumer confidence
D) An increase in the demand for domestic goods combined with an increase in welfare activities of the government
E) An increase in imports combined with even higher increase in exports
Correct Answer:

Verified
Correct Answer:
Verified
Q21: What is the natural level of output?
Q59: Which of the following will lead to
Q60: In an open economy, as the price
Q61: Figure 13-7 shows the short-run macroeconomic equilibrium
Q62: Figure 13-6 shows the short-run macroeconomic equilibrium
Q63: Which of the following will decrease aggregate
Q66: Ceteris paribus, which of the following would
Q67: The figure below shows the relationship between
Q102: Explain why the short-run supply curve is
Q112: Discuss the difference between an increase in