Multiple Choice
Figure 13-2 shows shifts in the aggregate demand curve. Which of the following combinations would be illustrated by a shift in aggregate demand from AD0 to AD1?Figure 13-2 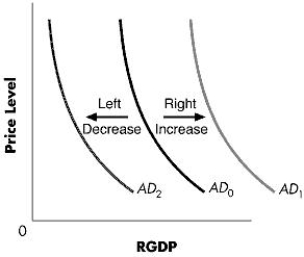
A) A slow increase in government purchases combined with a large decrease in investment
B) An increase in consumption combined with an increase in exports
C) An increase in business tax rates combined with a decrease in consumer confidence
D) An increase in the growth rates of a major trading partner combined with a severe slowdown in stock market wealth
E) An increase in exports combined with an even larger increase in imports
Correct Answer:

Verified
Correct Answer:
Verified
Q2: Which of the following statements is true?<br>A)The
Q3: Jason has been holding his retirement savings
Q4: An increase in disposable income would tend
Q5: Which of the following would shift both
Q6: Which of the following would be true
Q7: Which of the following will cause consumption
Q8: Stagflation is generally caused by:<br>A)an increase in
Q9: An increase in the U.S. price level
Q10: Which of the following variables changes along
Q11: A fall in the price level will