Multiple Choice
Use the following to answer questions :
Figure: Illustrating Slope 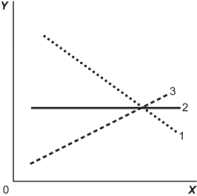
-(Figure: Illustrating Slope) Look at the figure Illustrating Slope. In the graph, line 3 depicts X and Y to be:
A) positively related.
B) unrelated.
C) negatively related.
D) both constants.
Correct Answer:

Verified
Correct Answer:
Verified
Q58: Use the following to answer questions :<br>Figure:
Q59: Use the following to answer questions :<br>Figure:
Q60: Use the following to answer questions:<br>Figure: Unemployment
Q61: In the graph of a curve, the
Q64: Use the following to answer questions :<br>Figure:
Q65: If two points on a graph are
Q66: Use the following to answer questions :<br>Figure:
Q67: If a supply curve is represented by
Q68: If two variables are positively related, on
Q112: A town hires more police officers and