Multiple Choice
Use the following to answer questions :
Figure: Seasonally Adjusted Unemployment Rate 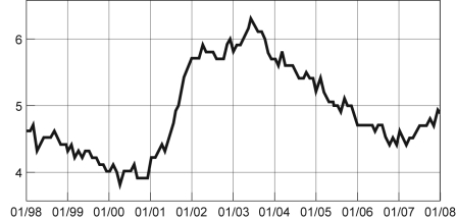
-(Figure: Seasonally Adjusted Unemployment Rate) Look at the figure Seasonally Adjusted Unemployment Rate. The distance between each labeled point on the horizontal axis is one year. What is the approximate slope of the graph between 1/2001 and 1/2003?
A) 2
B) 1
C) -1
D) -2
Correct Answer:

Verified
Correct Answer:
Verified
Q61: In the graph of a curve, the
Q63: Use the following to answer questions :<br>Figure:
Q64: Use the following to answer questions :<br>Figure:
Q65: If two points on a graph are
Q67: If a supply curve is represented by
Q68: If two variables are positively related, on
Q69: Professor Macro wants to use a numerical
Q70: Use the following to answer questions :
Q71: Use the following to answer questions :<br>Figure:
Q112: A town hires more police officers and