Multiple Choice
Use the following to answer questions :
Figure: Seasonally Adjusted Unemployment Rate 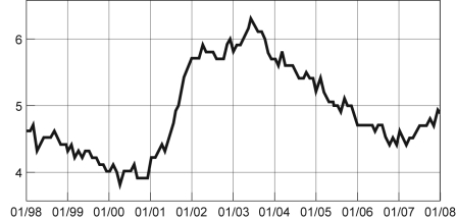
-(Figure: Seasonally Adjusted Unemployment Rate) Look at the figure Seasonally Adjusted Unemployment Rate. The distance between each labeled point on the horizontal axis is one year. Using this graph, the unemployment rate was at a minimum in ______ and a maximum in ______.
A) 2003; 2000
B) 2007; 2001
C) 2003; 1999
D) 2000; 2003
Correct Answer:

Verified
Correct Answer:
Verified
Q17: The relation between two variables that move
Q23: Use the following to answer questions :<br>Figure:
Q24: Use the following to answer questions :<br>Table:
Q24: A _ graph shows how the value
Q25: Use the following to answer questions :
Q26: Use the following to answer question :<br>Figure:
Q27: Use the following to answer questions: <img
Q30: Use the following to answer questions :<br>Figure:
Q31: Use the following to answer questions :<br>Figure:
Q33: Use the following to answer questions :<br>Figure: