Multiple Choice
Use the following to answer questions :
Figure: Seasonally Adjusted Unemployment Rate 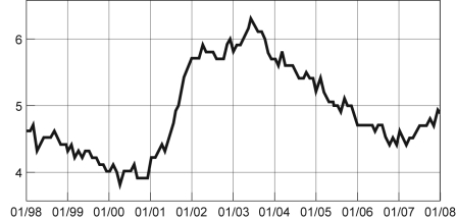
-(Figure: Seasonally Adjusted Unemployment Rate) Look at the figure Seasonally Adjusted Unemployment Rate. The distance between each labeled point on the horizontal axis is one year. What is the approximate slope of the graph between 1/2004 and 1/2006?
A) 1/2
B) 1
C) -1/2
D) -2
Correct Answer:

Verified
Correct Answer:
Verified
Q7: The _ of a curve shows the
Q17: The relation between two variables that move
Q24: A _ graph shows how the value
Q25: The owner of the Dismal Philosopher,one of
Q28: Use the following to answer questions :<br>Figure:
Q30: Use the following to answer questions :<br>Figure:
Q31: Use the following to answer questions :<br>Figure:
Q35: Use the following to answer questions :<br>Figure:
Q38: Use the following to answer question:<br>Figure: Slope
Q44: A positive relationship between swimsuits purchased and