Multiple Choice
Use the following to answer question
Figure: Education and Earnings 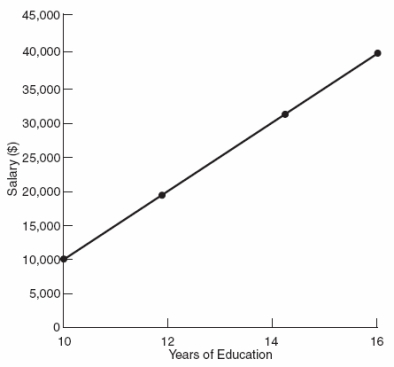
-(Figure: Education and Earnings) The hypothetical graph shows the relationship between years of education and salary.Which statement is NOT correct?
A) A person with 13 years of education can expect to earn $25,000.
B) The slope of the line is 5,000.
C) The line represents a simple model of the relationship between education and earnings.
D) The relationship between the two variables is nonlinear.
Correct Answer:

Verified
Correct Answer:
Verified
Q49: Use the following to answer questions <br>Figure:
Q50: Scarcity is BEST defined as when:<br>A) the
Q51: Use the following to answer questions <br>Figure:
Q52: What are some examples of the types
Q52: When government policies are being designed:<br>A) there
Q58: Use the following to answer questions<br>Figure: Sales
Q65: Macroeconomics focuses on decisions made for the
Q120: Allocative inefficiency implies that:<br>A) goods are produced
Q152: Briefly describe how macroeconomics and microeconomics are
Q197: Discounted matinee movie ticket prices demonstrate that<br>A)