Multiple Choice
Use the following to answer questions
Figure: Graph Interpretation 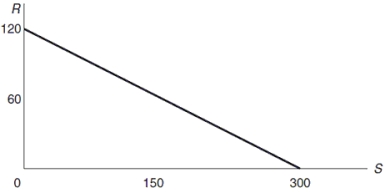
-(Figure: Graph Interpretation) In the graph,the equation for the line is:
A) R = 120 - 0.4S.
B) R = 120 - 300S.
C) R = 120 + 0.4S.
D) S = 300 + 120R.
Correct Answer:

Verified
Correct Answer:
Verified
Q49: Use the following to answer questions <br>Figure:
Q50: Scarcity is BEST defined as when:<br>A) the
Q52: What are some examples of the types
Q52: When government policies are being designed:<br>A) there
Q53: Use the following to answer question <br>Figure:
Q65: Macroeconomics focuses on decisions made for the
Q152: Briefly describe how macroeconomics and microeconomics are
Q197: Discounted matinee movie ticket prices demonstrate that<br>A)
Q249: If a restaurant that traditionally has served
Q322: Pie charts<br>A) depict two variables to see