Multiple Choice
Use the following to answer questions:
Figure: Price and Quantity 2 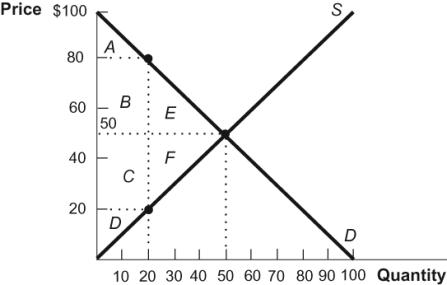
-(Figure: Price and Quantity 2) At a cost of $20 per unit in the diagram, the demanders whose wants are satisfied are represented by the section of the demand curve between a price of:
A) $100 and $80.
B) $100 and $50.
C) $0 and $100.
D) $20 and $80.
Correct Answer:

Verified
Correct Answer:
Verified
Q191: Use the following to answer questions:<br>Figure: Market
Q192: Figure: Demand Shift <img src="https://d2lvgg3v3hfg70.cloudfront.net/TB3377/.jpg" alt="Figure: Demand
Q193: Use the following to answer questions:<br>Figure: Market
Q194: How did the spread of the Internet
Q195: If sellers want to sell more products
Q197: When the price of a good decreases:<br>A)
Q198: An increase in quantity demanded is a
Q199: In a free market equilibrium, prices and
Q200: Why is the world unlikely to ever
Q201: Imagine a free market in equilibrium. After