Multiple Choice
Figure: Demand Shift 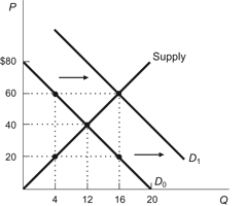 In the figure, the demand curve shifted from D0 to D1. To describe this movement, we would say that:
A) demand increased, which caused an increase in supply.
B) quantity demanded increased, which caused an increase in supply.
C) demand increased, which caused an increase in quantity supplied.
D) quantity demanded increased, which caused an increase in quantity supplied.
Correct Answer:

Verified
Correct Answer:
Verified
Q187: An increase in the price of corn
Q188: When supply decreases there is a _
Q189: Use the following to answer questions:<br>Figure: Market
Q190: In a free market, gains from trade
Q191: Use the following to answer questions:<br>Figure: Market
Q193: Use the following to answer questions:<br>Figure: Market
Q194: How did the spread of the Internet
Q195: If sellers want to sell more products
Q196: Use the following to answer questions:<br>Figure: Price
Q197: When the price of a good decreases:<br>A)