Multiple Choice
Use the following to answer questions:
Figure: Supply Shifts 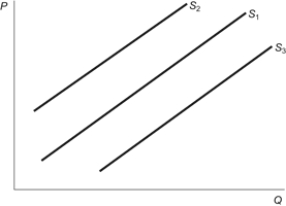
-(Figure: Supply Shifts) In the figure, the initial supply curve is S1. Producers engage in market speculation with the belief that the price of the good will increase in the near future. This would be represented in the figure by shifting the:
A) supply curve to S2, resulting in a lower quantity supplied at each price.
B) supply curve to S2, resulting in a higher quantity supplied at each price.
C) supply curve to S3, resulting in a lower quantity supplied at each price.
D) supply curve to S3, resulting in a higher quantity supplied at each price.
Correct Answer:

Verified
Correct Answer:
Verified
Q210: The quantity demanded is the quantity that
Q211: As the price of a good increases:<br>A)
Q212: The quantity demanded is the quantity that
Q213: Other things being equal, total consumer surplus
Q214: An increase in the use of labor-saving
Q216: What are factors that shift the demand
Q217: An increase in the price of a
Q218: Advertising, fads, and fashion are examples of
Q219: If golf course fees decrease, the demand
Q220: Use the following to answer questions:<br>Figure: Supply