Multiple Choice
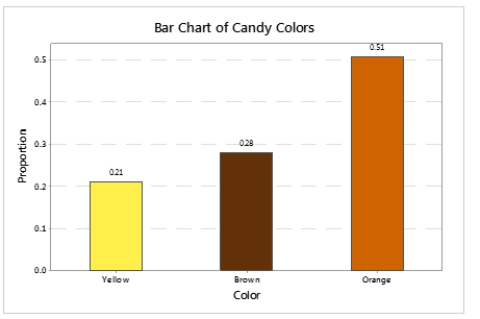
A student counted the number of candies of each color in a bag of 57 Reese's Pieces.The results are shown in the following bar graph.  What percentage of the candies were NOT colored orange?
A) 21%
B) 28%
C) 49%
D) 51%
Correct Answer:

Verified
Correct Answer:
Verified
Related Questions
Q4: Two statistics students are arguing over which
Q15: In a study of the effectiveness of
Q18: A numerical data set is _ if
Q19: A cardiologist is studying the effects of
Q21: The sum of all the relative frequencies
Q22: A survey records the number of U.S.states
Q23: A student counted the number of candies
Q24: A numeric data set is _ if
Q25: Relative frequency is BEST suited to describe
Q27: Concerning univariate data, a _ or _