Essay
Refer to the figure below. 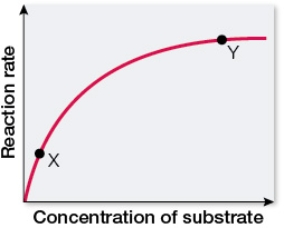 The graph was constructed from reaction-rate data collected using a constant amount of purified enzyme and increasing concentrations of substrate.Under conditions at point X, the graph indicates that the reaction rate changed dramatically when just a small increase in substrate concentration was made.Under conditions at point Y, the reaction rate changed very little with the same increase in substrate concentration.Explain why.
Correct Answer:

Verified
At point X, there is a large excess of e...View Answer
Unlock this answer now
Get Access to more Verified Answers free of charge
Correct Answer:
Verified
View Answer
Unlock this answer now
Get Access to more Verified Answers free of charge
Q160: In the pathway A + B <font
Q161: Refer to the graph below. <img src="https://d2lvgg3v3hfg70.cloudfront.net/TB5650/.jpg"
Q162: A readily reversible reaction, in which reactants
Q163: You are working with an enzyme and
Q164: A biochemist generates an enzyme activity curve
Q166: Some enzymes cause chemical bonds in their
Q167: Refer to the figure below. <img src="https://d2lvgg3v3hfg70.cloudfront.net/TB5650/.jpg"
Q168: The enzyme <font face="symbol"></font>-amylase increases the rate
Q169: Which term describes the high-energy state that
Q170: Refer to the figure below. <img src="https://d2lvgg3v3hfg70.cloudfront.net/TB5650/.jpg"