Short Answer
Refer to the graph below. 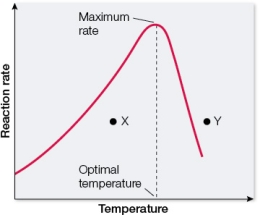 This graph shows the change in the rate of a reaction catalyzed by an enzyme as temperature is increased.At point _______, the low activity is due to denaturation of the enzyme, whereas at point _______, the low activity is due to low kinetic energies of the substrate and enzyme molecules in solution.
Correct Answer:

Verified
Correct Answer:
Verified
Q156: If all that is required to drive
Q157: Which will not increase the rate of
Q158: In order for a coupled reaction to
Q159: Enzymes increase the rate of a reaction
Q160: In the pathway A + B <font
Q162: A readily reversible reaction, in which reactants
Q163: You are working with an enzyme and
Q164: A biochemist generates an enzyme activity curve
Q165: Refer to the figure below. <img src="https://d2lvgg3v3hfg70.cloudfront.net/TB5650/.jpg"
Q166: Some enzymes cause chemical bonds in their