Short Answer
Data shown in the two graphs below are from experiments carried out on pyruvate dehydrogenase (PDH), the enzyme that catalyzes the conversion of pyruvate to acetyl CoA and carbon dioxide. 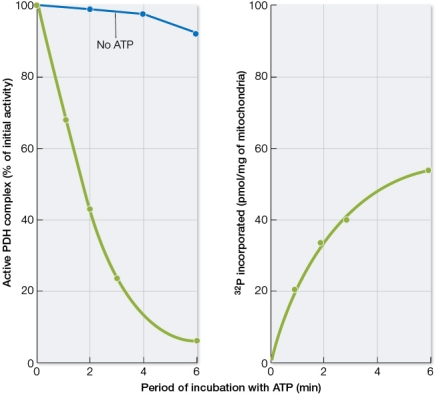 In the experiments, extracts of mitochondria were incubated for 6 minutes with high concentrations of ATP labeled with phosphorus-32.At various times, samples were removed and tested for PDH activity and incorporation of phosphorus-32 (32P) label into PDH.The results shown in the graphs suggest that PDH is regulated via a mechanism involving _______ of the PDH protein.
Correct Answer:

Verified
Correct Answer:
Verified
Q149: Refer to the reaction below. Glyceraldehyde 3-phosphate
Q150: The link between glycolysis and the citric
Q151: How are steps 1-3 of glycolysis different
Q152: In steps 6 through 10 of glycolysis,
Q153: Refer to the figure below. <img src="https://d2lvgg3v3hfg70.cloudfront.net/TB5650/.jpg"
Q155: The chemiosmotic generation of ATP is driven
Q156: If the regeneration of NAD<sup>+</sup> were inhibited
Q157: Refer to the table below. <img src="https://d2lvgg3v3hfg70.cloudfront.net/TB5650/.jpg"
Q158: When the supply of acetyl CoA being
Q159: Which is a viable path that a