Short Answer
Refer to the figure showing the steps used in microarray analysis to detect differences in expression between tumor tissue and normal tissue.The spots in the bottom panel represent individual genes for patients who have good prognoses (left) as well as for patients who have poor ones (right).The colors of those spots represent levels of expression: red = high expression, yellow = intermediate expression, green = low expression. 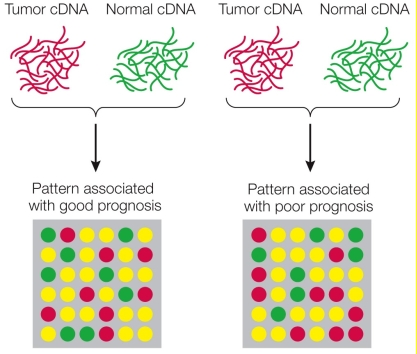 Look at the top leftmost spot.At this gene, patients with poor prognoses have _______ expression than patients with good prognoses.
Correct Answer:

Verified
Correct Answer:
Verified
Q195: Which feature is an advantage that viruses
Q196: A biologist used microarrays to examine how
Q197: cDNA and genomic libraries are created from
Q198: Which molecule is recombinant DNA?<br>A) A gene
Q199: Suppose you are a researcher who is
Q201: Which activity would be considered pharming?<br>A) Using
Q202: Which is not a major concern regarding
Q203: People who rely on rice as their
Q204: Refer to the table showing results from
Q205: Microarray technology relies on the production of