Essay
Refer to the graph showing beak size for a population of a species of Darwin's finches. 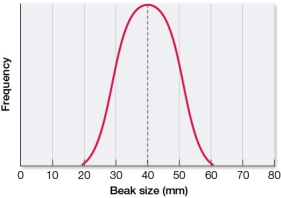 Draw a graph showing what the resulting population would most likely look like after a generation of stronger stabilizing selection.
Correct Answer:

Verified
Correct Answer:
Verified
Q187: There are three isolated populations of garter
Q188: A sparrow population currently eats seeds that
Q189: An allele in a population of trout
Q190: Yeast cells are sequenced periodically to examine
Q191: A population of salmon is becoming increasingly
Q193: Pharyngeal nerves in vertebrates are much longer
Q194: Suppose the population size of a species
Q195: Yeast cells are sequenced periodically to examine
Q196: In a population at Hardy-Weinberg equilibrium with
Q197: A locus has two alleles.The frequency of