Multiple Choice
Refer to the graph showing how different types of organisms respond to changes in environmental temperature. 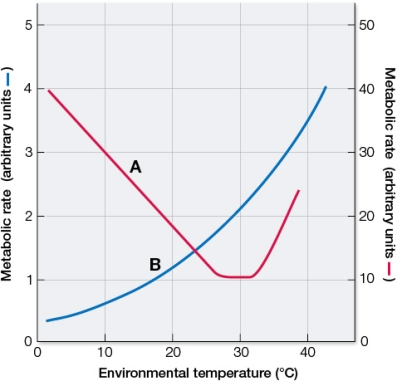 The curve labeled _______ is appropriate for a lizard, and the curve labeled _______ is appropriate for a mouse.As the environmental temperature these animals are subjected to rises from 10°C to 20°C, the metabolic rate of the lizard _______ and the metabolic rate of the mouse _______.
A) A; B; increases; decreases
B) A; B; decreases; increases
C) B; A; increases; decreases
D) B; A; decreases; increases
E) B; A; decreases; decreases
Correct Answer:

Verified
Correct Answer:
Verified
Q179: Refer to the graphs showing the results
Q180: Which physiological control mechanism in marine iguanas
Q181: Which statement about glial cells is true?<br>A)
Q182: Which type of tissue has a high
Q183: Animals that can modulate their body temperatures
Q185: The mechanisms of homeostasis<br>A) keep the internal
Q186: The Q<sub>10</sub> describes the temperature sensitivity of
Q187: Measurements of a fish's Q<sub>10</sub> made during
Q188: If you find that a tissue in
Q189: In certain "hot" fish such as bluefin