Multiple Choice
Refer to the graphs showing the results of an experiment in which researchers heated and cooled the hypothalamus of a mammal and determined its metabolic rates at different environmental (ambient) temperatures. 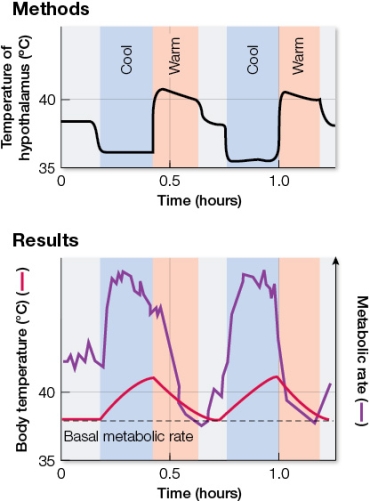 Based on the figure, which statement is true?
A) When the hypothalamus was cooled, body temperature fell.
B) When the hypothalamus was cooled, metabolic rate increased.
C) The metabolic rate was higher when the hypothalamus was warmed to 40°C.
D) The hypothalamic set point was increased when the hypothalamus was warmed to 40°C.
E) When the hypothalamus was warmed, body temperature increased.
Correct Answer:

Verified
Correct Answer:
Verified
Q174: A Q<sub>10</sub> value of 3 indicates that
Q175: The list below shows possible metabolic responses
Q176: The four basic tissue types are<br>A) squamous,
Q177: Mechanical systems, like physiological systems, can be
Q178: The list below shows possible metabolic responses
Q180: Which physiological control mechanism in marine iguanas
Q181: Which statement about glial cells is true?<br>A)
Q182: Which type of tissue has a high
Q183: Animals that can modulate their body temperatures
Q184: Refer to the graph showing how different