Short Answer
Refer to the graph showing ventilation rates in a human. 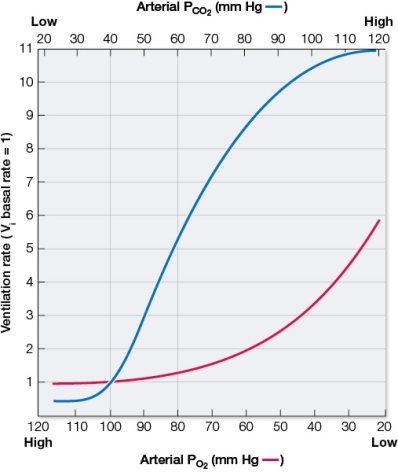 Based on the graph, it would take a drop in arterial PO2 from 100 mm Hg to about _______ mm Hg to bring about the same change in ventilation rate as an increase in arterial PCO2 from 40 mm Hg to 60 mm Hg.
Correct Answer:

Verified
Correct Answer:
Verified
Q212: Which statement about human fetal hemoglobin is
Q213: Which statement is true?<br>A) Water is 80
Q214: Which characterizes a right shift in the
Q215: Choose the correct pairing between aquatic animal
Q216: The rate of gas exchange in mammals
Q218: Which statement regarding diffusion of gases is
Q219: Refer to the figure. <img src="https://d2lvgg3v3hfg70.cloudfront.net/TB5650/.jpg" alt="Refer
Q220: The gills of fishes exhibit _ exchange.<br>A)
Q221: In a healthy person at rest, the
Q222: Refer to the figure. <img src="https://d2lvgg3v3hfg70.cloudfront.net/TB5650/.jpg" alt="Refer