Short Answer
Figure 8-25 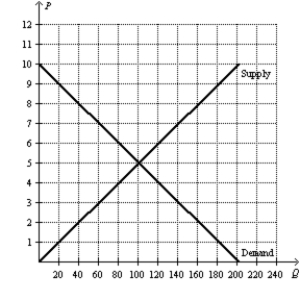
-Refer to Figure 8-25.Suppose the government places a $4 tax per unit on this good.How much is total surplus after the tax is imposed?
Correct Answer:

Verified
Total surp...View Answer
Unlock this answer now
Get Access to more Verified Answers free of charge
Correct Answer:
Verified
View Answer
Unlock this answer now
Get Access to more Verified Answers free of charge
Q9: Suppose that the market for product X
Q26: Suppose that instead of a supply-demand diagram,
Q40: Figure 8-26 <img src="https://d2lvgg3v3hfg70.cloudfront.net/TB2297/.jpg" alt="Figure 8-26
Q41: Scenario 8-3<br>Suppose the market demand and market
Q42: Figure 8-29 <img src="https://d2lvgg3v3hfg70.cloudfront.net/TB2297/.jpg" alt="Figure 8-29
Q46: Use the following graph shown to fill
Q48: Figure 8-25 <img src="https://d2lvgg3v3hfg70.cloudfront.net/TB2297/.jpg" alt="Figure 8-25
Q49: Figure 8-25 <img src="https://d2lvgg3v3hfg70.cloudfront.net/TB2297/.jpg" alt="Figure 8-25
Q141: Describe the Laffer curve.
Q146: Suppose the demand curve and the supply