Short Answer
Use the following graph shown to fill in the table that follows. 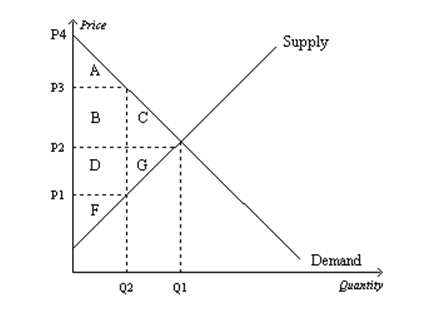
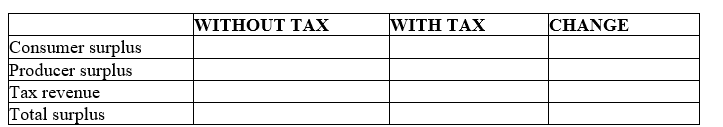
Correct Answer:

Verified
Correct Answer:
Verified
Q9: Suppose that the market for product X
Q26: Suppose that instead of a supply-demand diagram,
Q41: Scenario 8-3<br>Suppose the market demand and market
Q42: Figure 8-29 <img src="https://d2lvgg3v3hfg70.cloudfront.net/TB2297/.jpg" alt="Figure 8-29
Q45: Figure 8-25 <img src="https://d2lvgg3v3hfg70.cloudfront.net/TB2297/.jpg" alt="Figure 8-25
Q48: Figure 8-25 <img src="https://d2lvgg3v3hfg70.cloudfront.net/TB2297/.jpg" alt="Figure 8-25
Q49: Figure 8-25 <img src="https://d2lvgg3v3hfg70.cloudfront.net/TB2297/.jpg" alt="Figure 8-25
Q51: Figure 8-26 <img src="https://d2lvgg3v3hfg70.cloudfront.net/TB2297/.jpg" alt="Figure 8-26
Q141: Describe the Laffer curve.
Q146: Suppose the demand curve and the supply