Multiple Choice
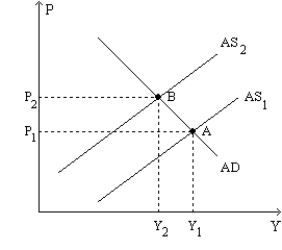
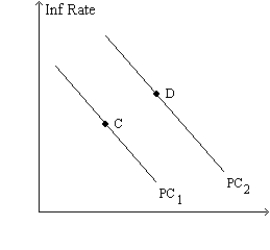
Figure 35-9.The left-hand graph shows a short-run aggregate-supply (SRAS) curve and two aggregate-demand (AD) curves.On the right-hand diagram,"Inf Rate" means "Inflation Rate." 

-Refer to Figure 35-9.Which of the following events could explain the shift of the aggregate-supply curve from AS1 to AS2?
A) a reduction in firms' costs of production
B) a reduction in taxes on consumers
C) an increase in the price level
D) an increase in the world price of oil
Correct Answer:

Verified
Correct Answer:
Verified
Q35: If a central bank increases the money
Q36: Which of the following would cause the
Q37: There is a temporary adverse supply shock.Given
Q39: In the 1970s,the Fed accommodated a(n)<br>A)adverse supply
Q41: Which of the following is an example
Q42: An increase in the price of oil
Q43: Figure 35-9.The left-hand graph shows a short-run
Q45: A favorable supply shock will cause the
Q129: An adverse supply shock causes inflation to<br>A)rise
Q131: An adverse supply shock will shift short-run