Multiple Choice
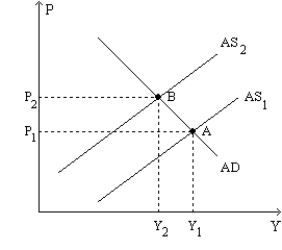
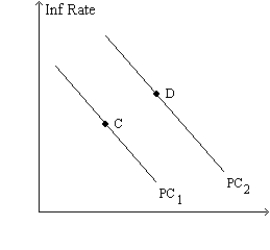
Figure 35-9.The left-hand graph shows a short-run aggregate-supply (SRAS) curve and two aggregate-demand (AD) curves.On the right-hand diagram,"Inf Rate" means "Inflation Rate." 

-Refer to Figure 35-9.A significant increase in the world price of oil could explain
A) the shift of the aggregate-supply curve from AS1 to AS2,but it could not explain the shift of the Phillips curve from PC1 to PC2.
B) the shift of the Phillips curve from PC1 to PC2,but it could not explain the shift of the aggregate-supply curve from AS1 to AS2.
C) both the shift of the aggregate-supply curve from AS1 to AS2 and the shift of the Phillips curve from PC1 to PC2.
D) neither the shift of the aggregate-supply curve from AS1 to AS2 nor the shift of the Phillips curve from PC1 to PC2.
Correct Answer:

Verified
Correct Answer:
Verified
Q39: In the 1970s,the Fed accommodated a(n)<br>A)adverse supply
Q40: Figure 35-9.The left-hand graph shows a short-run
Q41: Which of the following is an example
Q42: An increase in the price of oil
Q45: A favorable supply shock will cause the
Q46: Figure 35-9.The left-hand graph shows a short-run
Q47: In 1980,the combination of inflation and unemployment
Q48: Which of the following shifts aggregate supply
Q129: An adverse supply shock causes inflation to<br>A)rise
Q131: An adverse supply shock will shift short-run