Multiple Choice
Figure 34-6.On the left-hand graph,MS represents the supply of money and MD represents the demand for money;on the right-hand graph,AD represents aggregate demand.The usual quantities are measured along the axes of both graphs. 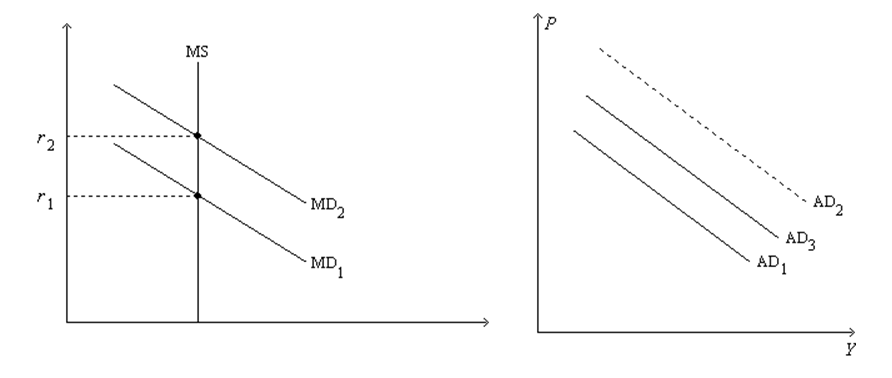
-Refer to Figure 34-6.Suppose the multiplier is 5 and the government increases its purchases by $15 billion.Also,suppose the AD curve would shift from AD1 to AD2 if there were no crowding out;the AD curve actually shifts from AD1 to AD3 with crowding out.Also,suppose the horizontal distance between the curves AD1 and AD3 is $55 billion.The extent of crowding out,for any particular level of the price level,is
A) $75 billion.
B) $40 billion.
C) $30 billion.
D) $20 billion.
Correct Answer:

Verified
Correct Answer:
Verified
Q110: If the multiplier is 6 and if
Q111: If the multiplier is 5.25,then the MPC
Q112: A tax increase has<br>A)a multiplier effect but
Q113: As real GDP falls,<br>A)money demand rises,so the
Q114: Figure 34-8 <img src="https://d2lvgg3v3hfg70.cloudfront.net/TB2297/.jpg" alt="Figure 34-8
Q116: Which of the following events shifts aggregate
Q117: Suppose there are both multiplier and crowding
Q118: If the MPC = 0.75,then the government
Q119: Which of the following tends to make
Q120: The marginal propensity to consume (MPC)is defined